--- title: X-rays redirect_from: - /docs/latest/users-guide/14-x-rays --- # X-rays X-rays are a way to get automatic insights and explorations of your data. ## Get automatic insights when clicking on a chart One great way to explore your data in general in Metabase is to click on points of interest in charts and selecting **Automatic insights**.  Metabase will give you some options: - **X-ray** - **Compare to the rest** In both cases, Metabase will take a look at the fields in that table or model, and automatically generate charts that summarize the data based on the data types it finds. Here's an example X-ray:  ## X-raying models and tables 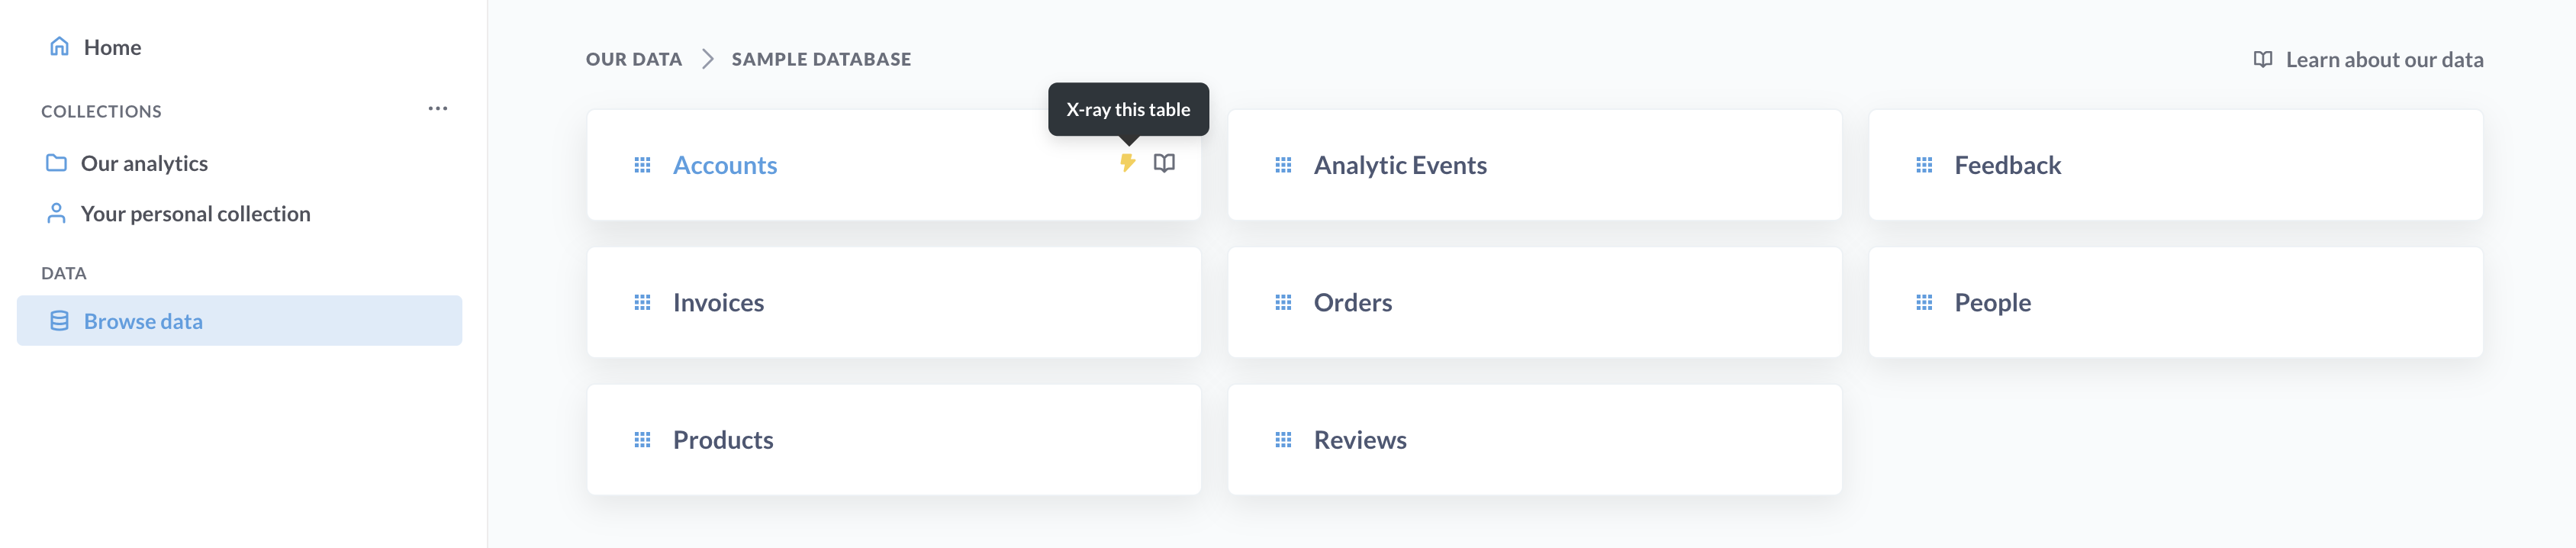 Another great way to get to know your data is by X-raying your models and tables. - **Table X-rays**: From the left nav, click on **Browse Data**, pick a database, hover over a table card, and click the lightning bolt icon table to view an X-ray of the table. - **Model X-rays**: Click on the ellipses for a model and select **X-ray this**. ## X-rays in the data reference You can also view an X-ray by browsing to a table and clicking on the lightning bolt icon. Click on the **Browse Data** button in the top navigation, select a database, and hover over a table to see the icon. From the Browse Data page, you can also click on `Learn about our data` to view the Data Reference section. From here you can navigate through databases, tables, columns, metrics, or segments, and you can click on the X-ray link in the left sidebar to see an X-ray of the item you're currently viewing.  ## Exploring newly added data sources If you're an administrator, when you first connect a database to Metabase, Metabot will offer to show you some automatic explorations of your newly connected data. ## Browsing through suggested X-rays Depending on the X-ray you're currently viewing, you'll see suggestions that will let you: - **Zoom out**: view an X-ray of the table the current X-ray is based on. - **Zoom in**: see a more detailed X-ray about a field or dimension of the current X-ray. - **Related**: X-ray some related data, like a metric based on the current table, or a different table related to the current one. ## Saving X-rays If you come across an X-ray that's particularly interesting, you can save its cards and filters as a dashboard by clicking the green **Save this** button. Metabase will create a new dashboard and save it to the Automatically generated dashboards collection (though you can move the dashboard to any collection you have curate access to). ## Disabling X-rays If for some reason X-rays aren't a good fit for your team or your data, administrators can turn them off completely by clicking on the gear icon in the upper right and going to **Admin settings** > **Settings** > **General** and toggling the option to **Enable X-ray features**. If you pin any dashboards in the "Our Analytics" collection, Metabase will hide the X-ray suggestions that appear on the homepage. Admins can also manually remove these suggestions by clicking on the **Customize** button in the upper right and selecting a dashboard as your homepage. [Changing the home page](../configuring-metabase/settings.md#custom-homepage) won't disable the X-ray features in the rest of Metabase.