-
Sameer Al-Sakran authoredSameer Al-Sakran authored

- Troubleshooting Process
- Specific Problems:
- Invalid Google Auth Token:
- How to detect this -
- How to fix this -
- Helpful tidbits
- Accessing the Metabase server logs
- Checking for Javascript errors in Chrome
- Checking for Javascript errors in Firefox
- Checking for Javascript errors in Safari
- Checking for Javascript errors in Internet Explorer
Troubleshooting Process
- Try to log in with a local account
- Try to log in with a Google Auth SSO account
- Example Javascript and Server logs if you are not able to log in.
Specific Problems:
Invalid Google Auth Token:
Sometimes your token from Google will expire.
How to detect this -
Open up the Javascript console. Try to log in with Google Auth, see if there are any error messages in the Javascript console indicating an invalid account.
Also open up your server logs, and see if there are any errors related to authentication. If there are, try re-creating the token.
How to fix this -
Remove the old token from the Google Auth SSO tab in the Admin Panel, and create a new one. If the root cause was an invalid auth token, this should fix the problem.
Helpful tidbits
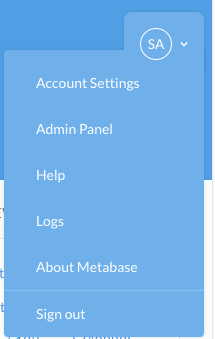
Accessing the Metabase server logs
While you can always look for the logs Metabase leaves on your server file system (or however you collect logs), if you are logged into Metabase with an admin account, you can also access them from the drop down menu in the upper right hand corner.
Checking for Javascript errors in Chrome
Metabase will print debugging information and errors to your browsers Javascript Console.
You can open the javascript console in Chrome by following the instructions at https://developers.google.com/web/tools/chrome-devtools/console/
Checking for Javascript errors in Firefox
Metabase will print debugging information and errors to your browsers Javascript Console.
You can open the javascript console in Mozilla by following the instructions at https://developer.mozilla.org/en-US/docs/Tools/Web_Console
Checking for Javascript errors in Safari
Metabase will print debugging information and errors to your browsers Javascript Console.
You can open the javascript console in Safari by following the instructions at
Checking for Javascript errors in Internet Explorer
Metabase will print debugging information and errors to your browsers Javascript Console.
You can open the javascript console in Internet Explorer by following the instructions at
https://msdn.microsoft.com/en-us/library/gg589530(v=vs.85).aspx
For many versions this can also be accessed by pressing the F12 key on your keyboard.